What is a Proof of Concept (PoC)?
A Proof of Concept in development is a way of showing that an idea of a product or program code is usable for its intended purpose and can be used in the real world.
In general, a prototype is built, tested, and finally approved for use.
A PoC is strictly scoped: Only the minimal work needed to verify that the idea is feasible, is performed. This way, if the idea is not feasible, the least amount of effort has been wasted. And if the idea was feasible, the time can then be spent to make a real implementation, suitable for release into the wild.
For me as a Developer the concept of this opens new possibilities to explore new ways of doing things and is more like working in a “sandbox” than in a real-life scenario.
Pushing the boundary
Over the past years as a Software Developer, I often ran into the same repetitive way of developing things.
Many projects use the same monotone form, and in my opinion, lack the “icing on the cake” by not using more “living” elements with visual transitions and possibilities for interaction etc.
Naturally using a program or an application shouldn’t be like playing a computer game because the focus is on the process and the purpose of its use.
But then I think again, why not? Wouldn’t it enhance the experience for the end user? At the very least, why not test the idea that we can enhance a boring product, by adding slick visualisations? And this is where a PoC is the perfect choice: Perform the minimal work to see the results and evaluate if it is worth the effort or not.
The PoC
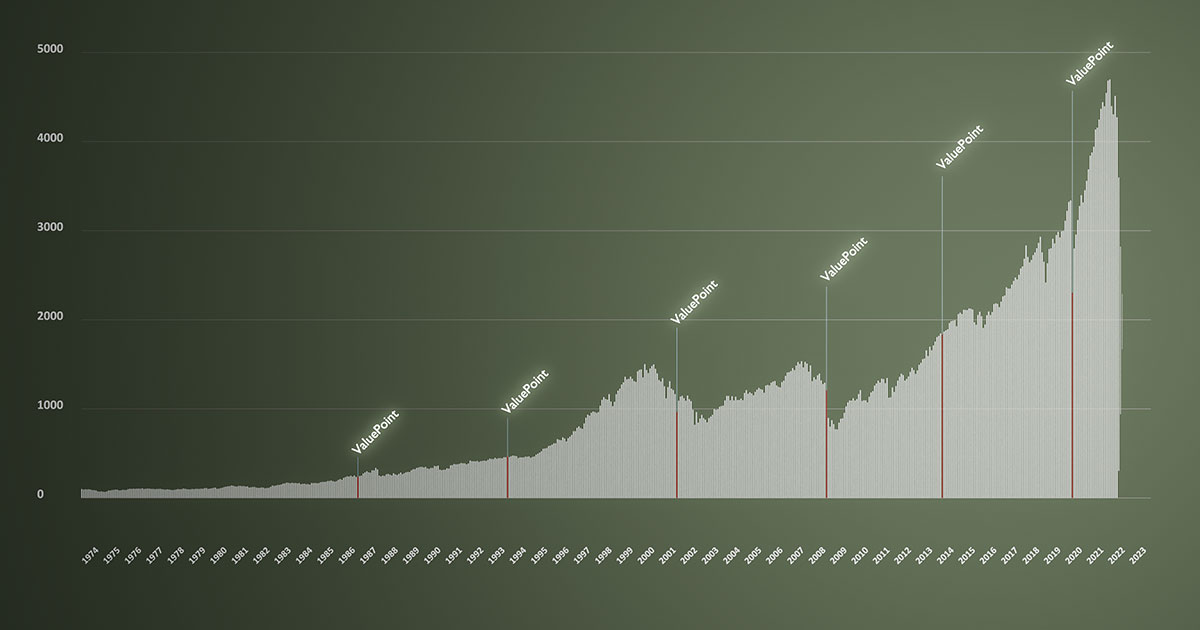
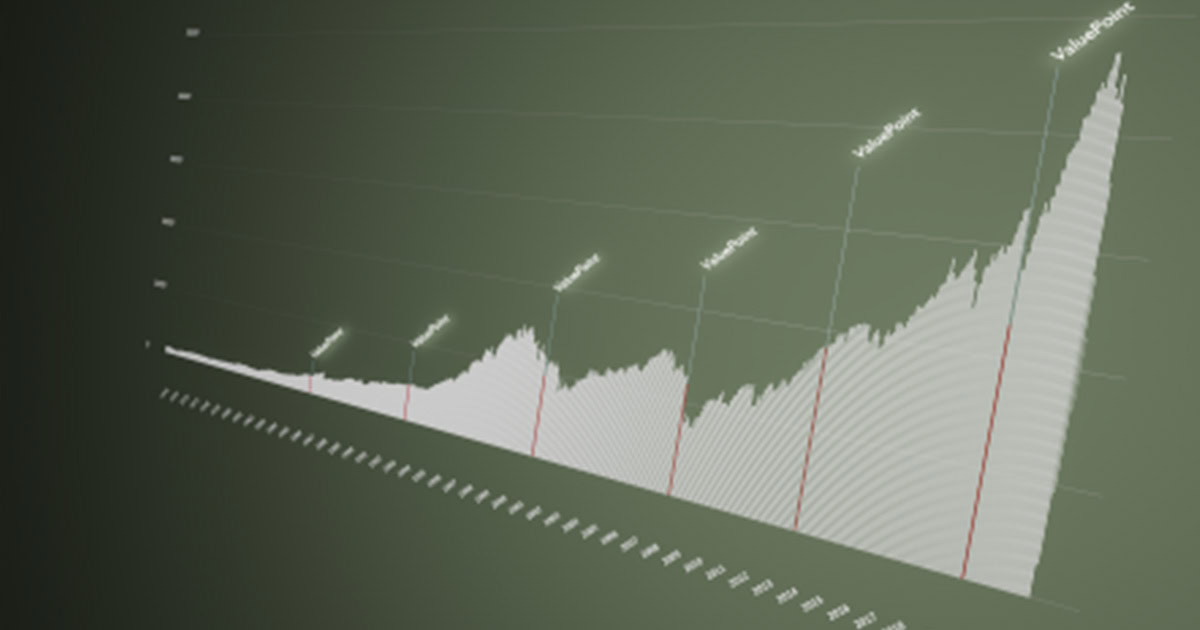
The need of a visualised chart came up through a brainstorm of ideas, and I wanted to test if a 3D version of this could be used in real life. Surely, this could easily be done by buying a piece of software already capable of producing this.
But what if we wanted to make a custom chart that didn’t follow a standard form, visual expression or other criteria the customer might need from an already build application or plugin? What if we wanted to be in total control of what the output would look like? What if we didn’t want to pay the license for an expensive commercial product, which might be totally overkill for our use?
My decision instantly fell on Blender 3D, an open-source application which can do almost all 3D visualisations that you can think of. Luckily, I have built up knowledge and gained experience with the program over the past few years. However, I knew almost nothing about coding inside Blender.
So the PoC became: “Can we produce visualisations with Blender 3D that enhance our product?”
Scripting it with Python
The visualisation could be done by manually building a Blender data representation for all the elements in the chart, but that would be a difficult and time-consuming process, which would have to be performed repeatedly each time the data needed to be displayed changed.
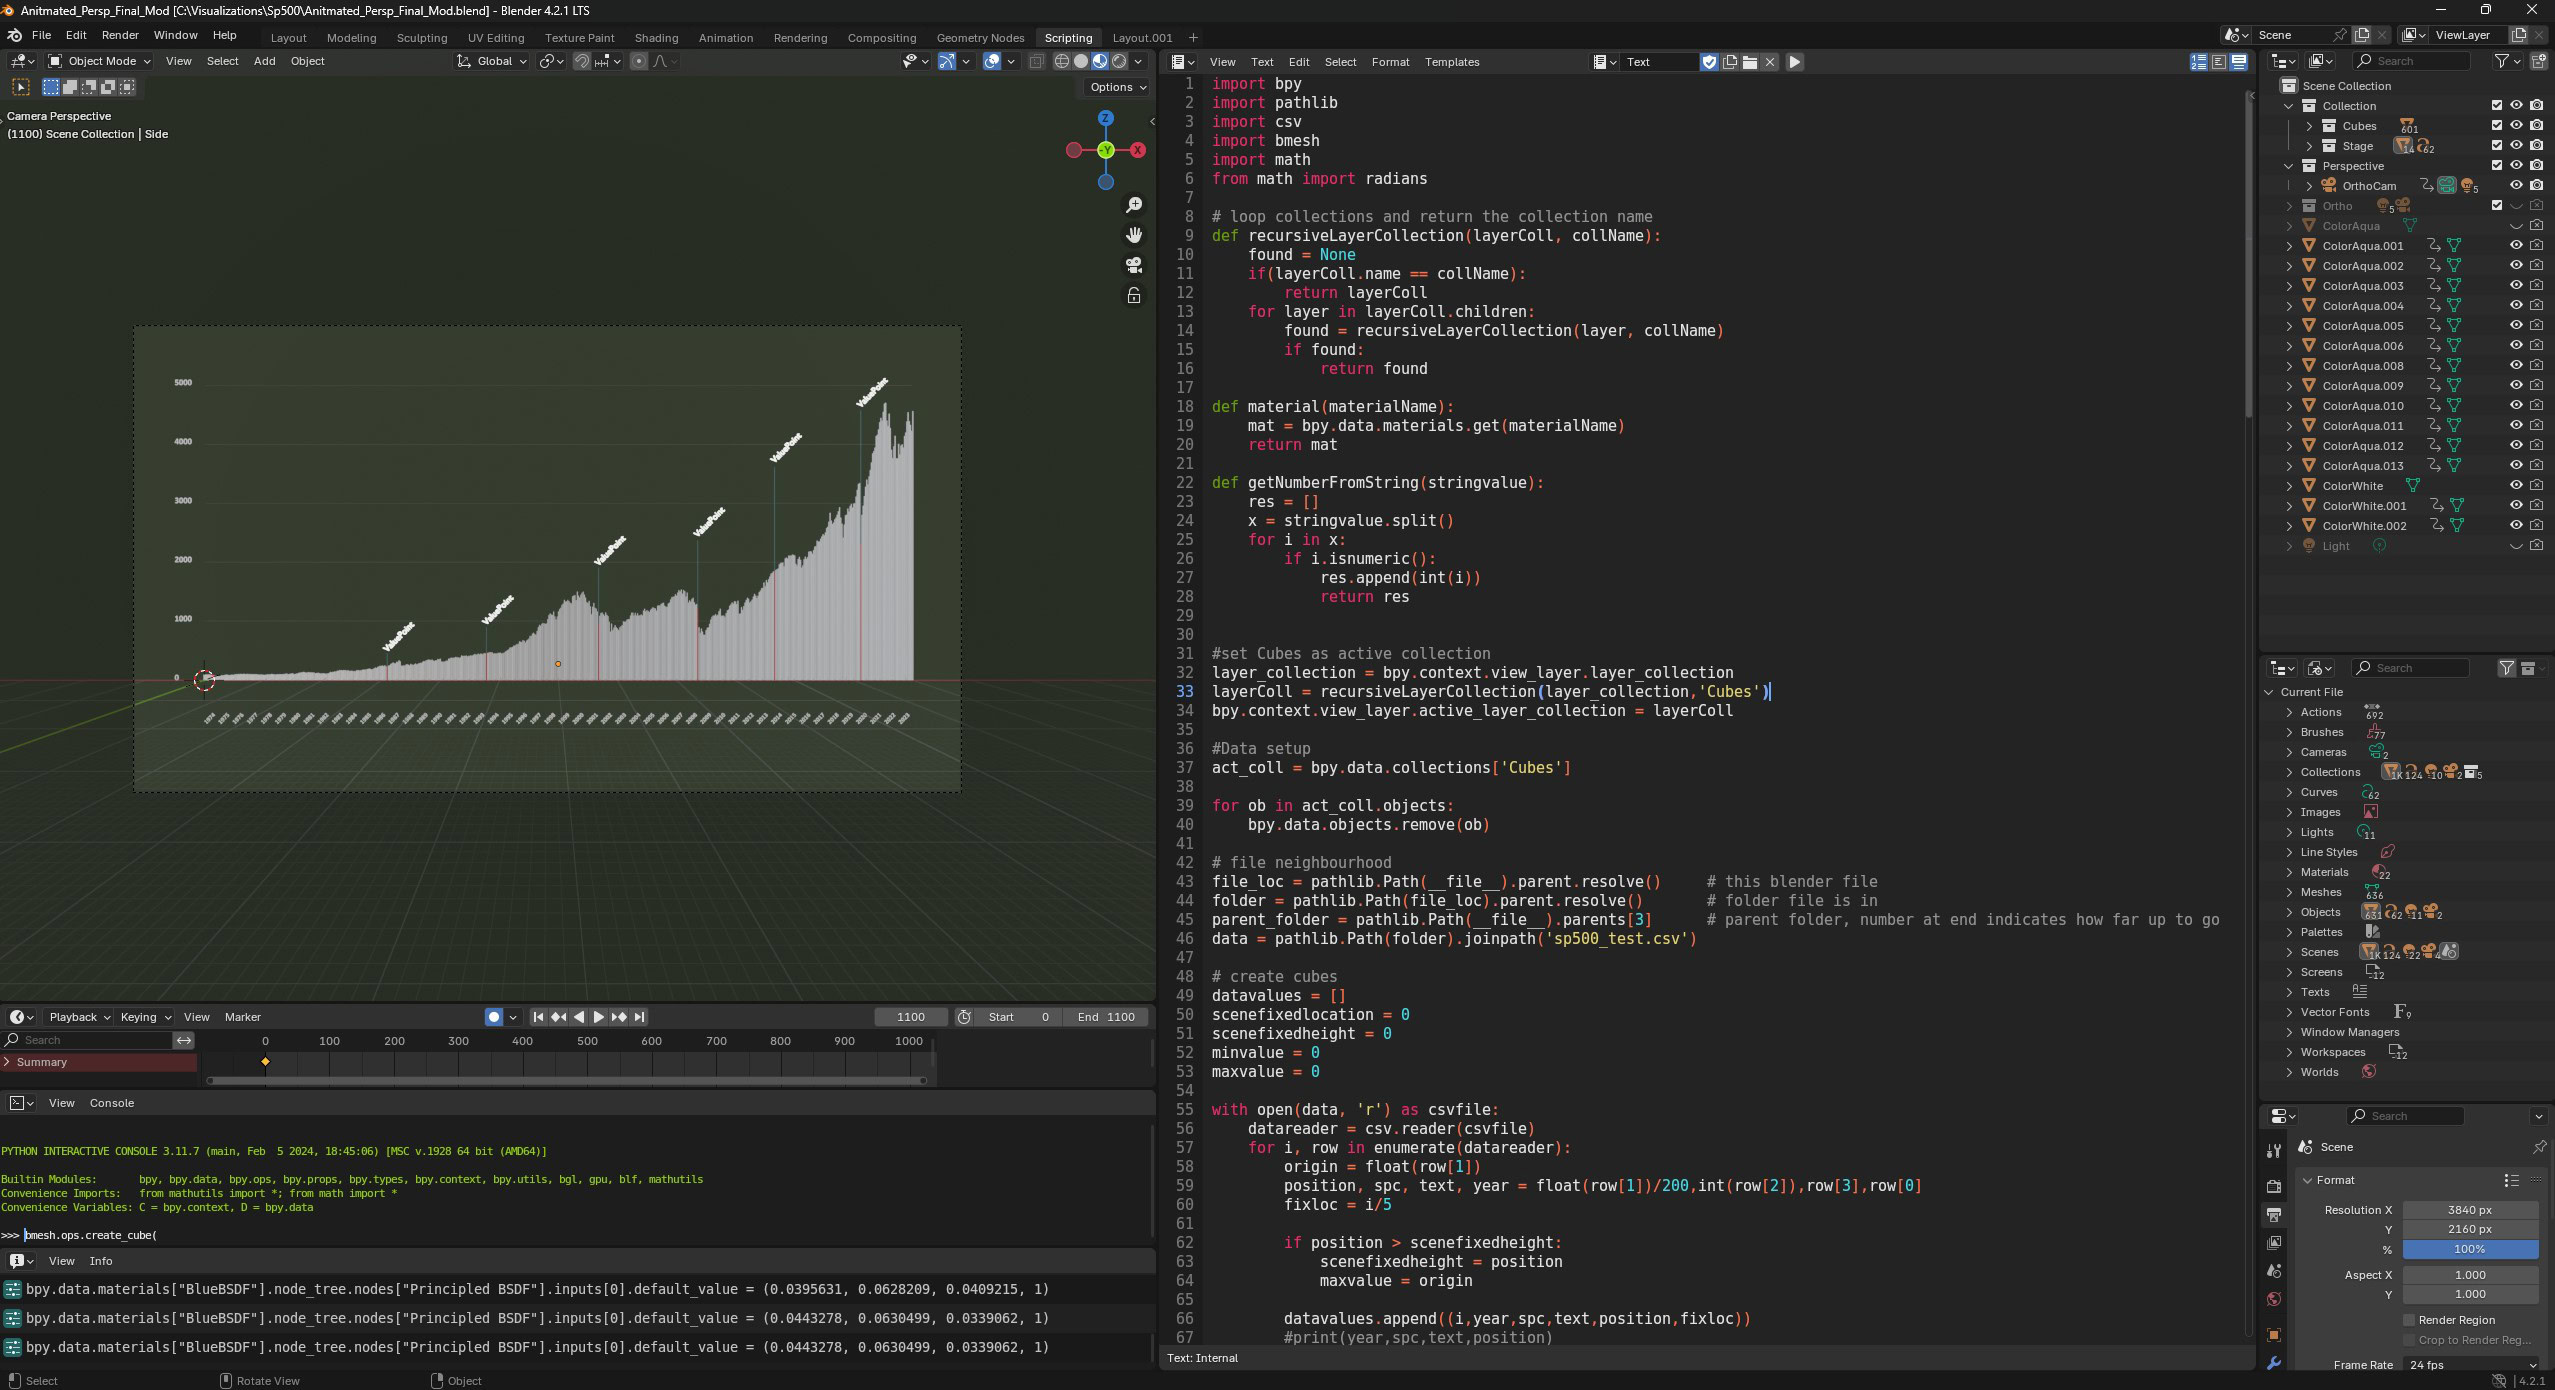
Instead, the approach that I used was scripting the whole scene in Python code, and with this it would be easier to reuse the scene and modify data, so that it could be reused for later purposes.
Actually at first when I started learning Blender, I was not aware, that every time an element is created in Blender it is Python code that works behind the scenes.
With that in mind, I started to look up resources on how to use that in the script to create the scene, and I soon realised that all the blender primitives, folder structure, colours etc. could be coded from Python.
The script itself loaded simple data from a predefined dataset, and by looping this I could build up the scene elements such as x-y axis scales and lines.
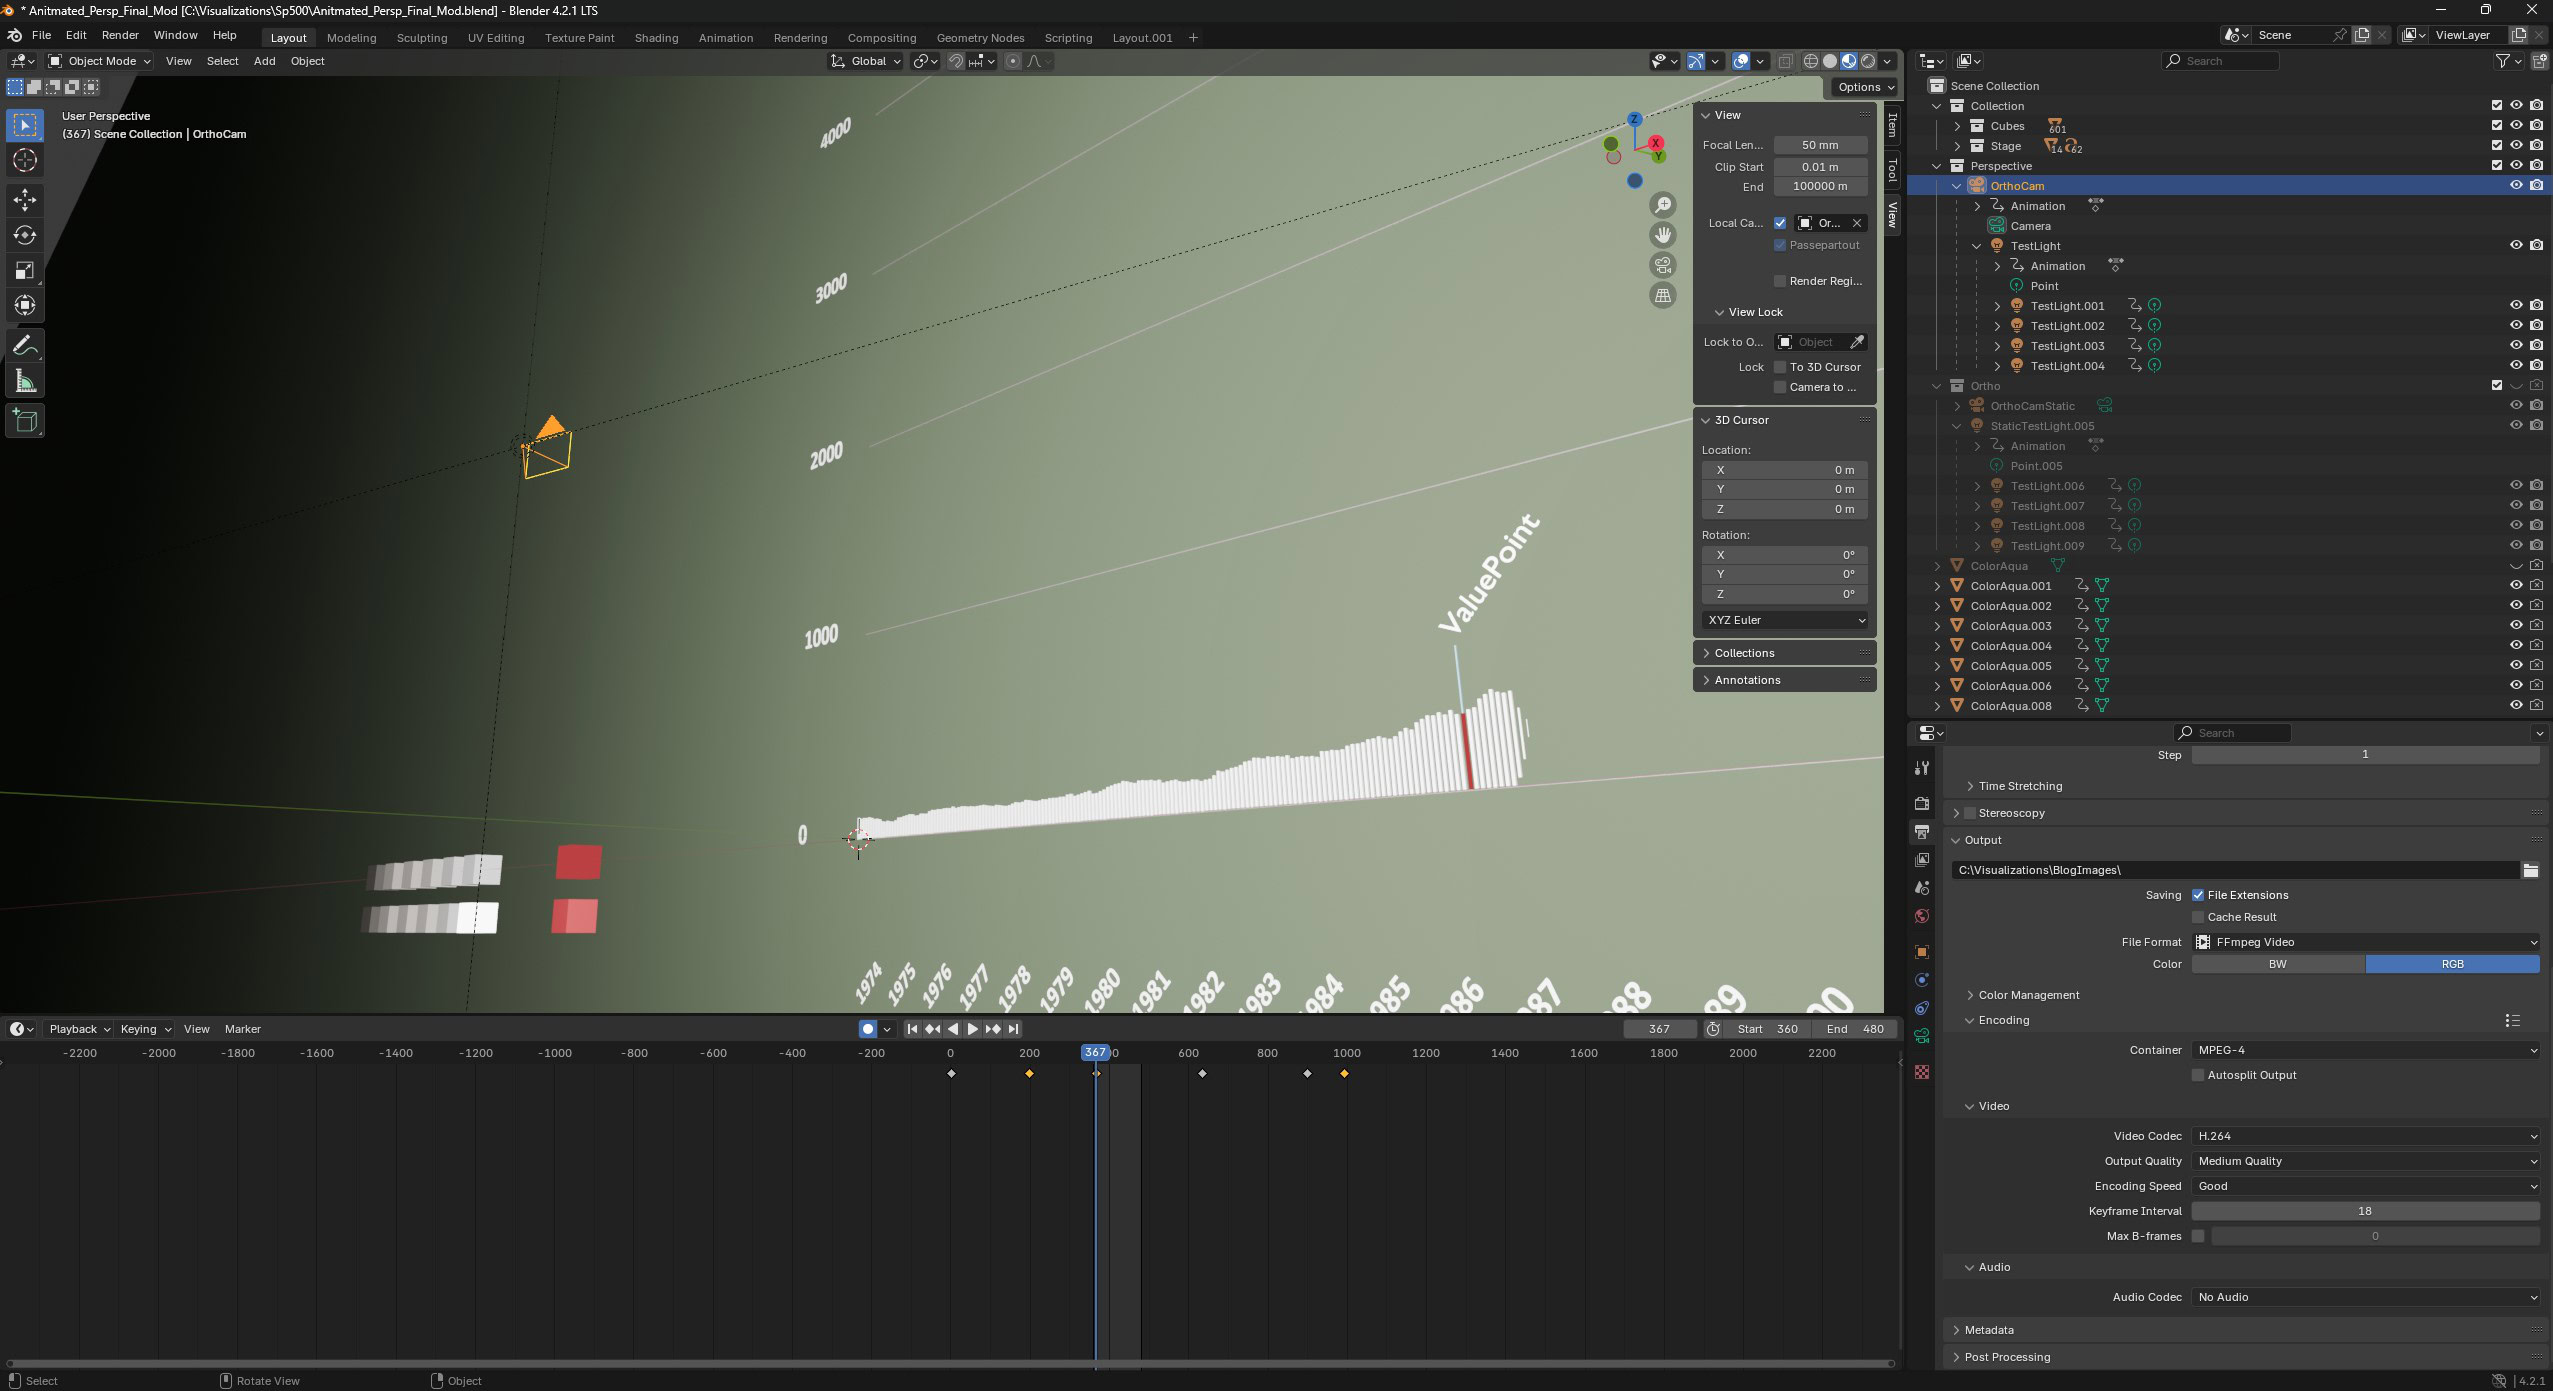
Building the columns from data was straightforward as I already used the loop on the data, but I must admit that the hardest part was when I had to calculate the offsets for animating the columns and adjusting them to the scene.
Fortunately, Blender has a build output console where it’s possible to see what is going on in the code.


